Hello, dear readers of the Tyulyagin project! Today we will talk about aluminum. In the article you will learn why aluminum is smelted and where it is used. But, mainly, the article will focus on comparing different countries in the production and smelting of aluminum. In the article you will find out which country is the largest aluminum producer in the world , as well as the largest exporters and importers of aluminum in the world . In addition, we will talk about the smelting of primary aluminum in Russia. Here you will find unique statistics on aluminum smelting in the USSR and Russia since 1932. Make yourself comfortable and enjoy reading.
What is aluminum produced for and where is it used?
Aluminum is a lightweight metal. Aluminum is the most abundant metal in the world. Due to its lightness, strength, functionality and resistance to corrosion, aluminum has become popular and is used in many structures.
If you look closely, you can find aluminum almost anywhere you go. It is used in homes, in transport, in various equipment, including mobile phones and computers, and in other household items - refrigerators, microwaves, furniture and so on.
However, the use of aluminum was minimal a hundred years ago. And 200 years ago they knew little at all about metal. Aluminum occupies about 8% of the entire earth's crust and is the third most abundant element after oxygen and silicon. Despite its prevalence, aluminum is not found in nature in its pure form, which is why it was practically not used for a long time. Aluminum was first produced only in 1824, and only 50 years later it began to be actively used in industry.
Aluminum is three times lighter than iron, but is almost as strong as steel, and in addition is ductile. It is not magnetic and conducts electricity. Capable of forming alloys with almost all other metals.
All these properties have allowed aluminum to become the most popular metal for humans. This metal is used in all modern and high-tech industries - construction, automotive, energy, aviation, food, and space. It is also used in modern electronic technology, shipbuilding and other industries.
Aluminum mining
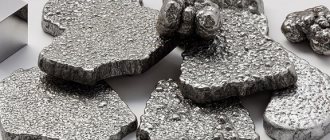
There are a huge number of minerals in which the presence of this metal was once discovered. Scientists have concluded that this metal can be extracted from more than 250 minerals. However, it is not profitable to extract metal from absolutely all ores, therefore, among all the existing variety, there are the most valuable aluminum ores, from which the metal is obtained. These are: bauxite, nepheline, and alunite. Of all aluminum ores, the maximum aluminum content is found in bauxite. They contain about 50% of aluminum oxides. As a rule, bauxite deposits are located directly on the earth's surface in sufficient quantities.
Bauxite is an opaque rock that is red or gray in color. The strongest bauxite samples on the mineralogical scale are rated at 6 points. They come in different densities from 2900 to 3500 kg/m3, which directly depends on the chemical composition.
Bauxite ores are distinguished by their complex chemical composition, which includes aluminum hydroxides, iron and silicon oxides, as well as from 40% to 60% of alumina, which is the main raw material for the production of aluminum. It is worth saying that the equatorial and tropical zones of the earth are the main areas that are famous for deposits of bauxite ore.
For the nucleation of bauxite, the participation of several components is necessary, including monohydrate alumina hydrate, boehmite, diaspore, as well as various iron hydroxide minerals along with iron oxide. The weathering of acidic, alkaline, and in some cases basic rocks, as well as the slow settling of alumina at the bottom of reservoirs, leads to the formation of bauxite ore.
From two tons of alumina, aluminum turns out to be half as much - 1 ton. And for two tons of alumina it is necessary to extract about 4.5 tons of bauxite. Aluminum can also be obtained from nephelines and alunites.
The former, depending on their grade, can contain from 22% to 25% alumina. While alunites are slightly inferior to bauxites, and consist of 40% aluminum oxide.
Rating of world countries for aluminum production and smelting for 2022
Since 2002, the leader in aluminum smelting in the world has been China . Today China smelts more than half of the world's aluminum production. At the end of 2022, China smelted 36,000 thousand tons , while 64,000 thousand tons of aluminum were produced worldwide. Following China are India and Russia ; they smelt approximately equal amounts of aluminum per year - 3,700 and 3,600 thousand tons, respectively.
For a long time, the United States was the leader in aluminum production in the world, until 2000. Today they are only at the end of the top ten with primary aluminum production at about 1,100 thousand tons. A complete list of countries by primary aluminum smelting can be found in the table below. USGS (United States Geological Survey) data was used as the main source of statistics.
| Rank | A country | Aluminum smelting, thousand tons | Year |
| World | 64000 | 2019 | |
| 1 | China | 36000 | 2019 |
| 2 | India | 3700 | 2019 |
| 3 | Russia | 3600 | 2019 |
| 4 | Canada | 2900 | 2019 |
| 5 | UAE | 2700 | 2019 |
| 6 | Australia | 1600 | 2019 |
| 7 | Bahrain | 1400 | 2019 |
| 8 | Norway | 1300 | 2019 |
| 9 | USA | 1100 | 2019 |
| 10 | Saudi Arabia | 916 | 2017 |
| 11 | Iceland | 870 | 2018 |
| 12 | Malaysia | 760 | 2017 |
| 13 | South Africa | 716 | 2017 |
| 14 | Brazil | 660 | 2018 |
| 15 | Qatar | 650 | 2017 |
| 16 | Mozambique | 577 | 2017 |
| 17 | Germany | 550 | 2017 |
| 18 | Argentina | 433 | 2017 |
| 19 | France | 430 | 2017 |
| 20 | Spain | 360 | 2017 |
| 21 | Iran | 338 | 2017 |
| 22 | New Zealand | 337 | 2017 |
| 23 | Romania | 282 | 2017 |
| 24 | Egypt | 279 | 2017 |
| 25 | Kazakhstan | 256 | 2017 |
| 26 | Oman | 253 | 2017 |
| 27 | Indonesia | 219 | 2017 |
Variety of aluminum products
The main advantages of aluminum are its light weight and ease of processing. Thanks to this, a wide range of different products are made from it. But first, rolled aluminum is produced from aluminum ingots: Rolled sheets. From it, in turn, they make: • Aluminum tires - rectangular (in cross-section) strips, with a thickness of 3 to 12 mm, and a width of 1 to 18 cm. They are sold in coils or strips from 3 to 9 m; • Thick sheet – aluminum plates from 6 mm or more. Most often produced in sizes specified by the customer, and used as blanks (for example, for the production of aircraft wings); • Thin sheet – sheet, thickness from 0.2 to 6 mm. It can be supplied both in sheets and in coils, it can be corrugated aluminum sheet, the so-called “Quintet”, or painted, depending on the wishes of the customer; • Foil – aluminum tape or strip with a thickness of 4 microns to 0.2 mm. Products that are in great demand in the food industry are most often sold in coils, but there are also options in sheets. Long products. This is, first of all: • A round rod of various sections; • Fittings; • Rod square, rectangular, or hexagonal; • Aluminum I-beams, angles, channels; • Wire of various thicknesses; • Ingots, rods or blanks. A rolled profile can be considered a separate aluminum product. Many narrowly targeted products are made from it. Hollow rolled metal. Most often these are aluminum pipes of various shapes and sizes. And although the main shape of aluminum pipe is round, rectangular and square pipes, and sometimes triangular ones, are often found. There are many known cases of manufacturing pipes of more complex shapes (but these are mainly custom-made items).
Leading countries in aluminum export and import
As I already wrote, aluminum today is used in many industries, in connection with this, not only its smelting is developed, but also trade. Countries around the world actively export and import aluminum for their own needs.
Thus, the largest exporter of aluminum in the world at the beginning of 2022 is Canada . In dollar terms, Canada exported more than $5.3 billion worth of aluminum. Also among the top five largest aluminum exporters in the world are the Netherlands, the UAE, Russia and India. You can see the full list of aluminum export countries
| № | A country | Aluminum exports, million $ |
| 1 | Canada | 5349 |
| 2 | Netherlands | 5115.8 |
| 3 | UAE | 5113.2 |
| 4 | Russia | 4640.9 |
| 5 | India | 3819.7 |
| 6 | Norway | 2802.1 |
| 7 | Australia | 2775.2 |
| 8 | Malaysia | 2003.2 |
| 9 | Bahrain | 1931.5 |
| 10 | Iceland | 1429.3 |
| 11 | Qatar | 1291.6 |
| 12 | China | 1100.5 |
| 13 | USA | 1050.4 |
| 14 | South Africa | 1009.7 |
| 15 | Saudi Arabia | 967.8 |
| 16 | Germany | 957.7 |
| 17 | Mozambique | 940.3 |
| 18 | Italy | 751.1 |
| 19 | New Zealand | 652.9 |
| 20 | France | 578.2 |
| 21 | Spain | 574.9 |
| 22 | Great Britain | 516.6 |
| 23 | Kazakhstan | 513.3 |
| 24 | Poland | 466.6 |
| 25 | South Korea | 445.5 |
| 26 | Slovakia | 385.1 |
| 27 | Slovenia | 372 |
| 28 | Sweden | 362 |
| 29 | Austria | 323.2 |
| 30 | Oman | 296.3 |
| 31 | Romania | 291.9 |
| 32 | Argentina | 264.7 |
| 33 | Luxembourg | 262.7 |
| 34 | Greece | 256.5 |
| 35 | Belgium | 254.1 |
| 36 | Brazil | 236.1 |
| 37 | Vietnam | 231.7 |
| 38 | Türkiye | 219.9 |
| 39 | Egypt | 196 |
| 40 | Singapore | 187.6 |
| 41 | Switzerland | 187 |
| 42 | Taiwan | 185.6 |
| 43 | Chech republic | 176.5 |
| 44 | Tajikistan | 175.2 |
| 45 | Hungary | 137.1 |
| 46 | Bosnia and Herzegovina | 121.1 |
| 47 | Ghana | 106.6 |
| 48 | Cameroon | 100 |
| 49 | Indonesia | 88.7 |
| 50 | Thailand | 88.5 |
| 51 | Azerbaijan | 84.6 |
| 52 | Montenegro | 76.6 |
| 53 | Iran | 76.4 |
| 54 | Japan | 56.6 |
| 55 | Venezuela | 54 |
| 56 | Nigeria | 51.7 |
| 57 | Finland | 31.7 |
| 58 | Albania | 23.4 |
| 59 | Ukraine | 22 |
| 60 | Portugal | 16.5 |
| 61 | Bulgaria | 16 |
| 62 | Serbia | 11.8 |
| 63 | Hong Kong | 11.1 |
| 64 | Ireland | 10.4 |
| 65 | Georgia | 10.3 |
| 66 | Angola | 9 |
| 67 | Iraq | 8.5 |
| 68 | Lebanon | 8 |
| 69 | Estonia | 7.3 |
| 70 | Mongolia | 7.1 |
| 71 | Latvia | 5.7 |
| 72 | Mexico | 5.5 |
| 73 | Syria | 5.3 |
| 74 | Sri Lanka | 5.2 |
| 75 | Jordan | 4.8 |
| 76 | Morocco | 4.2 |
| 77 | Tunisia | 3.9 |
| 78 | Libya | 3.8 |
| 79 | Armenia | 3.4 |
| 80 | Denmark | 2.9 |
| 81 | Kuwait | 2.9 |
| 82 | Croatia | 2.5 |
| 83 | Gabon | 2.3 |
| 84 | Myanmar (Burma) | 2.1 |
| 85 | Cambodia | 2 |
| 86 | Mauritius | 1.8 |
| 87 | Algeria | 1.8 |
| 88 | Pakistan | 1.3 |
| 89 | Kyrgyzstan | 1.2 |
| 90 | Zambia | 1.2 |
| 91 | Colombia | 1.1 |
| 92 | Uzbekistan | 1.1 |
| 93 | Congo | 1 |
| 94 | Afghanistan | 0.9 |
| 95 | North Macedonia | 0.9 |
| 96 | Belarus | 0.8 |
| 97 | Peru | 0.6 |
| 98 | Philippines | 0.4 |
| 99 | Andorra | 0.4 |
| 100 | Tanzania | 0.4 |
| 101 | Lithuania | 0.3 |
| 102 | Equatorial Guinea | 0.3 |
| 103 | Kenya | 0.3 |
| 104 | Yemen | 0.2 |
| 105 | DR Congo | 0.2 |
| 106 | Laos | 0.2 |
| 107 | New Caledonia | 0.2 |
| 108 | Israel | 0.2 |
| 109 | Costa Rica | 0.2 |
| 110 | Virgin Islands | 0.1 |
| 111 | Moldova | 0.1 |
| 112 | Ecuador | 0.1 |
| 113 | Chile | 0.1 |
| 114 | Somalia | 0.1 |
| 115 | Samoa | 0.1 |
The largest importers of aluminum in the world are (the share of world imports is indicated in brackets):
- USA (12.6%)
- Germany (9.1%)
- Japan (4.5%)
- Netherlands (4.5%)
- France (3.9%)
- Mexico (3.9%)
- Italy (3.6%)
- South Korea (3.6%)
- China (3.3%)
- UK (2.9%)
Aluminum ores of Russia
The Russian Federation is ranked 7th among all countries in the world in terms of the amount of aluminum ore mined. It is worth noting that this raw material is mined in colossal quantities on the territory of the Russian state. However, the country is experiencing a significant shortage of this metal, and is not able to provide it in the volume necessary to absolutely supply the industry. This is the priority reason why Russia has to purchase aluminum ores from other countries, as well as develop deposits with low quality mineral ores.
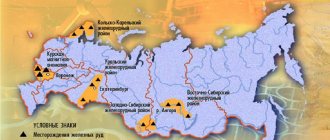
There are about 50 deposits in the state, the largest number of which are located in the European part of the state.
However, Radynkskoye is the oldest aluminum ore deposit in Russia. Its location is the Leningrad region. It consists of bauxite, which since ancient times has been the main and irreplaceable material from which aluminum is subsequently produced. Table 1. The largest bauxite deposits in Russia
| Name | Content % | Percentage of total reserves | Degree of industrial development | |
| AL2O3 | SiO2 | |||
| "Little Red Riding Hood" Severouralsk | 53.7 | 3.7 | 3.1 | In developing |
| Kalinskoye, Severouralsk | 56.0 | 2.6 | 3.6 | In developing |
| Cheremuzovskoye, Sverdlosk region | 54.2 | 4.0 | 11.0 | In developing |
| Novo-Kalinskoye, Severouralsk | 55.0 | 3.1 | 7.0 | In developing |
| Iksinskoe, st. Navolok | 53.5 | 17.4 | 11.4 | In developing |
| Vezhayu-Vorykvinskoye. Komi Republic | 49.2 | 0.1 | 11.3 | In preparation |
| Vislovskoye, Belgorod | 49.1 | 7.9 | 12.1 | In reserve |
Dynamics of aluminum production by year in the USSR and Russia since 1932
Above I attach a graph with unique statistics on aluminum smelting in the USSR and Russia since 1932. It was in 1932 that aluminum production began in the country. Until now, aluminum was only imported. Imports of aluminum were also high during the Second World War; at that time, our own capacities were still not enough, and aluminum was actively imported from foreign countries, including the USA, Great Britain and Canada. However, aluminum production grew rapidly in the post-war years. By the end of the 1980s, primary aluminum smelting in the USSR reached 3.5 million tons. Like other industries, after the collapse of the USSR, the production of non-ferrous metals in Russia decreased. This happened in the flesh until 1995. Then the smelting of primary aluminum began to grow and by 2004 Russia exceeded the record smelting of the USSR. Despite this achievement, in recent years, aluminum smelting in Russia has begun to decline, reaching its peak in 2008 at 4.19 million tons; smelting at the end of 2022 amounted to only 3.6 million tons.
When drawing up the schedule, data archives from the USGS and the USSR State Statistics Committee were used.
And that’s all for today about aluminum and the lists of countries by smelting and exporting aluminum in the world. Add the article to bookmarks and share with friends. Subscribe to new articles and analytics by e-mail. See you again on the pages of the Tyulyagin !
- 3
Shared
